|
100
|
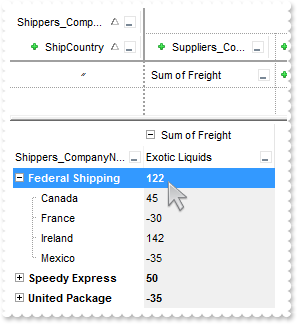
How can I programmatically clear the control's filter
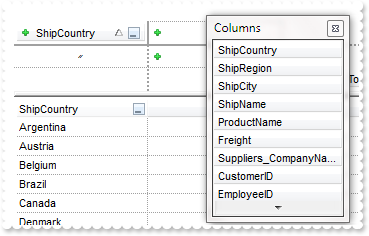
*** Click event - Occurs when the user presses and then releases the left mouse button over the control. ***
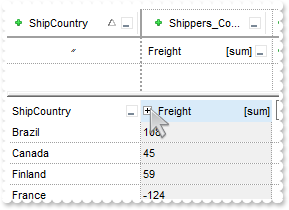
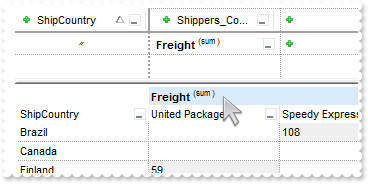
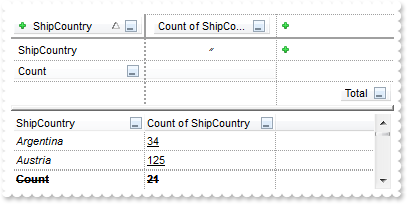
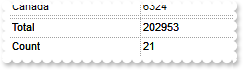
LPARAMETERS nop
with thisform.Pivot1
.ClearFilter
endwith
with thisform.Pivot1
.BeginUpdate
.Import("C:\Program Files\Exontrol\ExPivot\Sample\data.txt")
.FilterBarPromptVisible = 1
.FilterBarPromptPattern = "USA"
.EndUpdate
endwith
|
|
99
|
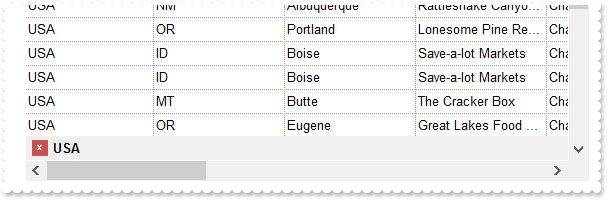
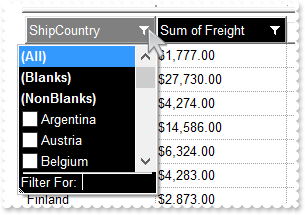
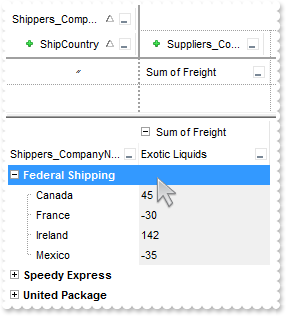
Is it possible to prevent closing the control's filter bar, so it is always shown (prompt-combined)
with thisform.Pivot1
.BeginUpdate
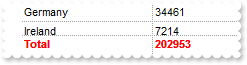
.Import("C:\Program Files\Exontrol\ExPivot\Sample\data.txt")
.FilterBarPromptPattern = "USA"
.FilterBarPromptVisible = 3 && FilterBarVisibleEnum.exFilterBarVisible Or FilterBarVisibleEnum.exFilterBarPromptVisible
.EndUpdate
endwith
|
|
98
|
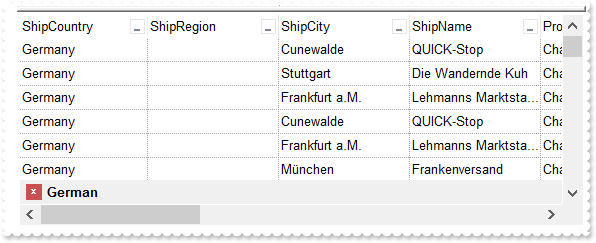
Is it possible to prevent closing the control's filter bar, so it is always shown (prompt)
with thisform.Pivot1
	.BeginUpdate
	.Import("C:\Program Files\Exontrol\ExPivot\Sample\data.txt")
	.FilterBarPromptVisible = 1
	.FilterBarPromptPattern = "USA"
	.EndUpdate
endwith
|
|
97
|
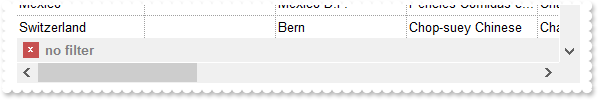
Is it possible to prevent closing the control's filter bar, so it is always shown
with thisform.Pivot1
	.BeginUpdate
	.Import("C:\Program Files\Exontrol\ExPivot\Sample\data.txt")
	.FilterBarCaption = "len(value) = 0 ? `<fgcolor=808080>no filter` : value"
	.FilterBarPromptVisible = 2
	.EndUpdate
endwith
|
|
96
|
How can I find if the control is running in DPI mode
with thisform.Pivot1
	DEBUGOUT( .FormatABC("dpi = 1 ? `normal/stretch mode` : `dpi mode`") )
endwith
|
|
95
|
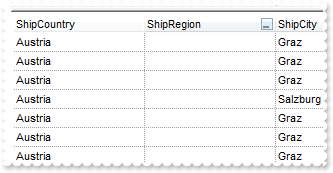
If I connect it to a datasource, all works perfectly but the records that I see in the control is a little number of total of the recordset. I need to show all 60.000 rows of the recordset without click on the [...] button. It s possible to setting up this parameters
with thisform.Pivot1
	.DisplayPivotData = -1
	.Import("C:\Program Files\Exontrol\ExPivot\Sample\data.txt")
endwith
|
|
94
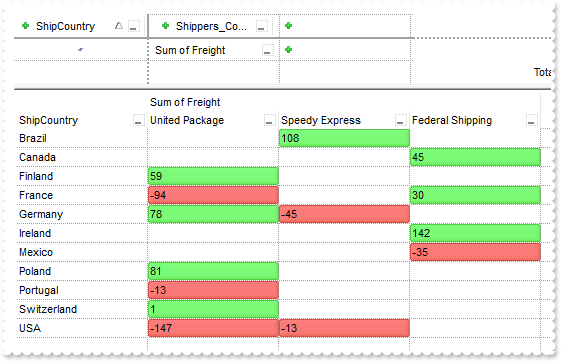
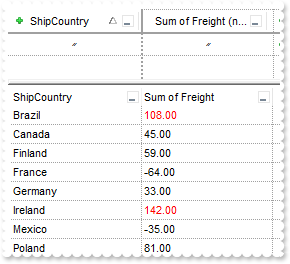
|
How do I change the drop down filter icon/button (white)
with thisform.Pivot1
.BeginUpdate
with .VisualAppearance
var_s = "gBFLBCJwBAEHhEJAAEhABX8GACAADACAxSDEMQBQKAAzQFAYbhgHCGAAGQaBUgmFgAQhFcZQSKUOQTDKNYykCIRSDUJYkSZEIyjBI8ExXFqNACkGKwYgmNYiTLAcgANJ"
var_s = var_s + "0WBaGIZJ4gOT5fDKMoEDRRYADFCscwxJybQAqGQKKb+VgAVY/cTyBIAEQSKA0TDOQ5TSKWB4JPZQRBEbZMNBtBIUJquKaqShdQJCU5FdY3Xblez9P7AMBwLFEC4NQ8YN"
var_s = var_s + "YuPhjR4dRTIMhvVAsUArFh8Zg9GZZFjmDIDT4ydBLTQwcyVIKnP5qOa6XbmPoCQDYKxZHYxPzVDa3axuL76dqCAT7XrXNy1TbNRrzQKfcJqfCbdw2YaDZLOOT3fjuI4h"
var_s = var_s + "hKaRzFAHJ+jYQ4xHuY4gHuGIXGeExqC8Tp6C+PoEm+G5ImycRgh0XwvDGa5rgOeoejyXwnFeQp2mkf5ClgBB9gCWIYAwfYAEKV58mkdwOggNArgOXY2EWLoDkKOA0mgb"
var_s = var_s + "hOGgZApgaSBIHWSYHSmbApgYThmESZYJkIeIkgeCpfliLIHgpMIcmUYYYmODAlg2SI4mWfRfGOEguDcCRjFYAJihCQhJBSDoRmONgKEcI4kFCEJhhOVYTmYnAlEAQhWB"
var_s = var_s + "MJYJGYWoWmWSR2F6F5lnkWAQhUAgpEieRWEuSYkjWGpmkmNhuhuZwJkYcocmaaYkjyEhngnUA6lEFAlAEgI="
.Add(2,var_s)
.Add(1,"CP:2 -6 -4 2 4")
endwith
.Object.Background(0) = 0x1000000
.Object.Background(32) = .BackColor
.HeaderVisible = .T.
.HeaderHeight = 24
.Import("C:\Program Files\Exontrol\ExPivot\Sample\data.txt")
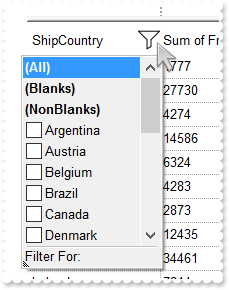
.DisplayFilterList = 288 && FilterListEnum.exShowCheckBox Or FilterListEnum.exSortItemsAsc
.PivotBarVisible = 1
.EndUpdate
endwith
|
|
93
|
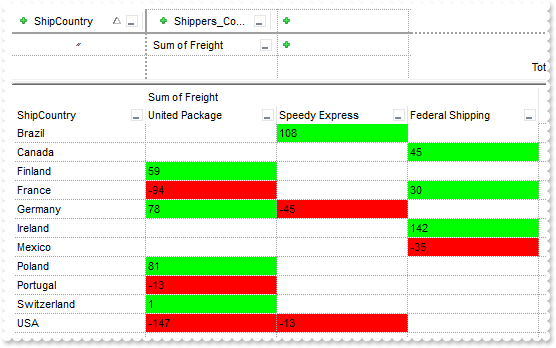
How do I change the drop down filter icon/button (black)
with thisform.Pivot1
	.BeginUpdate
	with .VisualAppearance
		var_s = "gBFLBCJwBAEHhEJAAEhABXUIQAAYAQGKIcBiAKBQAGYBIJDEMgzDDAUBjKKocQTC4AIQjCK4JDKHYJRpHEZyCA8EhqGASRAFUQBYiWE4oSpLABQaK0ZwIGyRIrkGQgQg"
		var_s = var_s + "mPYDSDNU4zVIEEglBI0TDNczhNDENgtGYaJqHIYpZBcM40TKkEZoSIITZcRrOEBiRL1S0RBhGcRUHZlWzdN64LhuK47UrWdD/XhdVzXRbjfz1Oq+bxve48Br7A5yYThd"
		var_s = var_s + "r4LhOFQ3RjIL4xbIcUwGe6VZhjOLZXjmO49T69HTtOCYBEBA"
		.Add(1,var_s)
	endwith
	.Object.Background(0) = 0x1000000
	.Object.Background(32) = -1
	.BackColorHeader = RGB(0,0,0)
	.ForeColorHeader = RGB(255,255,255)
	.HeaderVisible = .T.
	.HeaderHeight = 22
	.Import("C:\Program Files\Exontrol\ExPivot\Sample\data.txt")
	.DisplayFilterList = 288 && FilterListEnum.exShowCheckBox Or FilterListEnum.exSortItemsAsc
	.EndUpdate
endwith
|
|
92
|
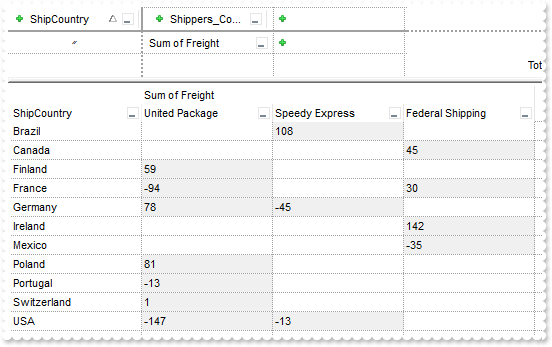
How do I prevent showing the control's BackColorAlternate property on empty / non-items part of the control
with thisform.Pivot1
	.BeginUpdate
	.BackColorAlternate = 0x7ff0f0f0
	.Import("C:\Program Files\Exontrol\ExPivot\Sample\data.txt")
	.PivotRows = "12"
	.PivotColumns = "sum(5)"
	.EndUpdate
endwith
|
|
91
|
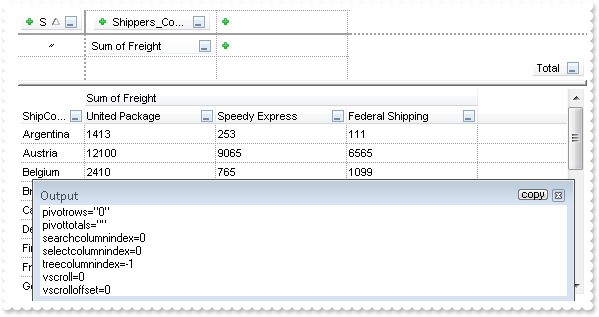
How can I find out if the user clicks the grid's header
*** MouseMove event - Occurs when the user moves the mouse. ***
LPARAMETERS Button, Shift, X, Y
	with thisform.Pivot1
		DEBUGOUT( "Type of ColumnFromPoint: " )
		DEBUGOUT( .ColumnFromPoint(-1,-1) )
		DEBUGOUT( " should not be VT_NULL" )
		DEBUGOUT( "Type of ValueFromPoint: " )
		DEBUGOUT( .ValueFromPoint(-1,-1) )
		DEBUGOUT( " should be VT_NULL" )
	endwith

with thisform.Pivot1
	.Import("C:\Program Files\Exontrol\ExPivot\Sample\data.txt")
	.PivotRows = "0"
	.PivotColumns = "sum(5)"
endwith
|
|
90
|
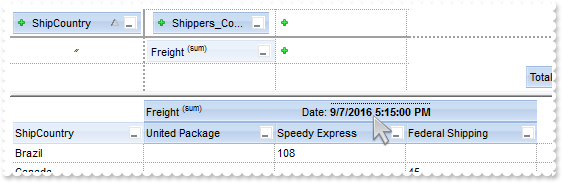
What should I set FormatPivotHeader to, to show it on the columns header only
with thisform.Pivot1
	.BeginUpdate
	.Import("C:\Program Files\Exontrol\ExPivot\Sample\data.txt")
	.PivotRows = "0"
	.PivotColumns = "sum(5)/12"
	var_s = "(iaggregate ? ( caption + ` <off -6><font ;6>(` + lower(caggregate) + ')</off></font>') : caption) + ( ( display=1 ? `<c>Date: <"
	var_s = var_s + "b><upline><dotline>` + date(`now`) : `` ) + `</dotline> </b>` )"
	.FormatPivotHeader = var_s
	.EndUpdate
endwith
|
|
89
|
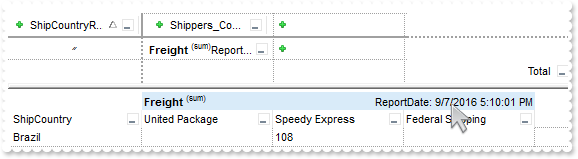
What should I set FormatPivotHeader to, to show "Report Generated on 7/9/2016 14:20" etc when the report is executed (ie the date and time will change)
with thisform.Pivot1
	.BeginUpdate
	.Import("C:\Program Files\Exontrol\ExPivot\Sample\data.txt")
	.PivotRows = "0"
	.PivotColumns = "sum(5)/12"
	var_s = "(iaggregate ? (`<b>` + caption + `</b> <off -6><font ;6>(` + lower(caggregate) + ')</off></font>') : caption) + `<r>ReportDate: "
	var_s = var_s + "` + date(`now`)"
	.FormatPivotHeader = var_s
	.EndUpdate
endwith
|
|
88
|
Is it possible to display aggregate result on parent rows as well
with thisform.Pivot1
	.BeginUpdate
	.HeaderHeight = 22
	.DefaultItemHeight = 20
	.Import("C:\Program Files\Exontrol\ExPivot\Sample\data.txt")
	.PivotRows = "12[bold],0"
	with .FormatConditionalAppearances.Add("nempty","not empty","")
		.Expression = "len(value) != 0"
		.BackColor = RGB(240,240,240)
	endwith
	.PivotColumns = "sum(5)[nempty]/6"
	.IncludeExpandColumn = 1
	.DrawGridLines = 0
	.ShowBranchRows = 33 && ShowBranchRowsEnum.exBranchIncludeAggregate Or ShowBranchRowsEnum.exBranchTree
	.EndUpdate
endwith
|
|
87
|
How do I show expanded/collapsed rows
with thisform.Pivot1
	.BeginUpdate
	.HeaderHeight = 22
	.DefaultItemHeight = 20
	.Import("C:\Program Files\Exontrol\ExPivot\Sample\data.txt")
	.PivotRows = "12[bold],0"
	with .FormatConditionalAppearances.Add("nempty","not empty","")
		.Expression = "len(value) != 0"
		.BackColor = RGB(240,240,240)
	endwith
	.PivotColumns = "sum(5)[nempty]/6"
	.IncludeExpandColumn = 1
	.DrawGridLines = 0
	.EndUpdate
endwith
|
|
86
|
How do I show expanded/collapsed columns
with thisform.Pivot1
	.BeginUpdate
	.HeaderHeight = 22
	.DefaultItemHeight = 20
	.Import("C:\Program Files\Exontrol\ExPivot\Sample\data.txt")
	.PivotRows = "0"
	with .FormatConditionalAppearances.Add("nempty","not empty","")
		.Expression = "len(value) != 0"
		.BackColor = RGB(240,240,240)
	endwith
	.PivotColumns = "sum(5)[nempty]/12"
	.FormatPivotHeader = "(iaggregate ? ( caption + ` <r>[` + lower(caggregate) + `]` ) : caption)"
	.IncludeExpandColumn = 1
	.EndUpdate
endwith
|
|
85
|
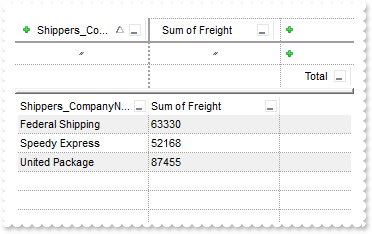
Where you have say "Sum of ...." as the first row heading of the pivot are there and options to be able to change this text as a whole
with thisform.Pivot1
	.BeginUpdate
	.Import("C:\Program Files\Exontrol\ExPivot\Sample\data.txt")
	.PivotRows = "0"
	with .FormatConditionalAppearances.Add("nempty","not empty","")
		.Expression = "len(value) != 0"
		.BackColor = RGB(240,240,240)
	endwith
	.PivotColumns = "sum(5)[nempty]/12"
	.FormatPivotHeader = "(iaggregate ? (`<b>` + caption + `</b> <off -6><font ;6>(` + lower(caggregate) + ' )') : caption)"
	.EndUpdate
endwith
|
|
84
|
How can I get the data column from the cursor
*** MouseMove event - Occurs when the user moves the mouse. ***
LPARAMETERS Button, Shift, X, Y
	with thisform.Pivot1
		DEBUGOUT( "DataColumn" )
		DEBUGOUT( .DataColumnFromPoint(-1,-1) )
	endwith

with thisform.Pivot1
	.Import("C:\Program Files\Exontrol\ExPivot\Sample\data.txt")
	.PivotRows = "0"
	.PivotColumns = "sum(5)[content=numeric]"
	.Refresh
endwith
|
|
83
|
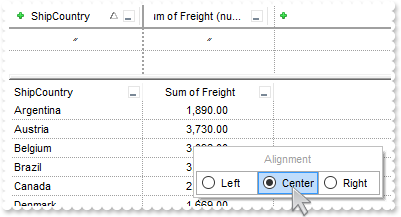
Is there any way for the user to change the alignment at runtime (using excontextmenu)
*** RClick event - Occurs once the user right clicks the control. ***
LPARAMETERS nop
	with thisform.Pivot1
		h = .DataColumns.item(5).Alignment && .DataColumns.item(5).Alignment
		c = CreateObject("Exontrol.ContextMenu")
		with c
			.FlatImageWidth = 0
			var_s = "Alignment[align=1][dis],[group=0x71](Left[typ=2][grp=100][close=0][id=0],Center[typ=2][grp=100][close=0][id=1],Right[typ=2][grp="
			var_s = var_s + "100][close=0][id=2])"
			.ToString = var_s
			.item(h).Checked = .T.
			h = .Select()
		endwith
		with .DataColumns.item(5)
			.Alignment = h && h
			.HeaderAlignment = h && h
		endwith
		.Refresh
	endwith

with thisform.Pivot1
	.PivotBarVisible = 3609 && PivotBarVisibleEnum.exPivotBarAllowResizeColumns Or PivotBarVisibleEnum.exPivotBarAllowUndoRedo Or PivotBarVisibleEnum.exPivotBarAutoUpdate Or PivotBarVisibleEnum.exPivotBarShowTotals Or PivotBarVisibleEnum.exPivotBarAutoFit Or PivotBarVisibleEnum.exPivotBarVisible
	.Import("C:\Program Files\Exontrol\ExPivot\Sample\data.txt")
	with .DataColumns.item(5)
		.Alignment = 2
		.HeaderAlignment = 2
	endwith
	.PivotRows = "0"
	.PivotColumns = "sum(5)[content=numeric]"
	.Refresh
endwith
|
|
82
|
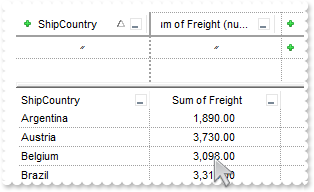
Is there any way for the user to change the alignment at runtime
*** RClick event - Occurs once the user right clicks the control. ***
LPARAMETERS nop
	with thisform.Pivot1
		DEBUGOUT( "The column gets aligned to the center" )
		with .DataColumns.item(5)
			.Alignment = 1
			.HeaderAlignment = 1
		endwith
		.Refresh
	endwith

with thisform.Pivot1
	.Import("C:\Program Files\Exontrol\ExPivot\Sample\data.txt")
	with .DataColumns.item(5)
		.Alignment = 2
		.HeaderAlignment = 2
	endwith
	.PivotRows = "0"
	.PivotColumns = "sum(5)[content=numeric]"
	.Refresh
endwith
|
|
81
|
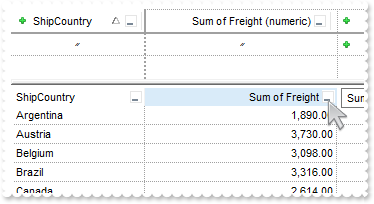
How can I align a column to the right
with thisform.Pivot1
	.Import("C:\Program Files\Exontrol\ExPivot\Sample\data.txt")
	with .DataColumns.item(5)
		.Alignment = 2
		.HeaderAlignment = 2
	endwith
	.PivotRows = "0"
	.PivotColumns = "sum(5)[content=numeric]"
	.Refresh
endwith
|
|
80
|
How can I display the control's content on an single A3 paper size, when using PDF format
with thisform.Pivot1
	.BeginUpdate
	.VisualAppearance.Add(1,"c:\exontrol\images\normal.ebn")
	.Import("C:\Program Files\Exontrol\ExPivot\Sample\data.txt")
	.FormatConditionalAppearances.item("positive").BackColor = 0x100ff00
	.FormatConditionalAppearances.item("negative").BackColor = 0x10000ff
	.PivotRows = "0"
	.PivotColumns = "sum(5)[positive,negative]/12"
	.ExpandAll
	var_CopyTo = .CopyTo("C:\Temp\Preview.pdf|11.69 in x 16.53 in||single")
	DEBUGOUT( "Look for C:\Temp\Preview.pd file." )
	.EndUpdate
endwith
|
|
79
|
How can I display the control's content on an A3 paper size, when using PDF format
with thisform.Pivot1
	.BeginUpdate
	.VisualAppearance.Add(1,"c:\exontrol\images\normal.ebn")
	.Import("C:\Program Files\Exontrol\ExPivot\Sample\data.txt")
	.FormatConditionalAppearances.item("positive").BackColor = 0x100ff00
	.FormatConditionalAppearances.item("negative").BackColor = 0x10000ff
	.PivotRows = "0"
	.PivotColumns = "sum(5)[positive,negative]/12"
	.ExpandAll
	var_CopyTo = .CopyTo("C:\Temp\Preview.pdf|11.69 in x 16.53 in")
	DEBUGOUT( "Look for C:\Temp\Preview.pd file." )
	.EndUpdate
endwith
|
|
78
|
How can I export the control's content to a PDF document (method 1)
with thisform.Pivot1
	.BeginUpdate
	.VisualAppearance.Add(1,"c:\exontrol\images\normal.ebn")
	.Import("C:\Program Files\Exontrol\ExPivot\Sample\data.txt")
	.FormatConditionalAppearances.item("positive").BackColor = 0x100ff00
	.FormatConditionalAppearances.item("negative").BackColor = 0x10000ff
	.PivotRows = "0"
	.PivotColumns = "sum(5)[positive,negative]/12"
	.ExpandAll
	.EndUpdate
	with CreateObject("Exontrol.Print")
		.PrintExt = thisform.Pivot1.Object
		.CopyTo("c:/temp/xtest.pdf")
	endwith
	DEBUGOUT( "Look for C:\Temp\xtest.pdf file." )
	.EndUpdate
endwith
|
|
77
|
How can I export the control's content to a PDF document (method 2)
with thisform.Pivot1
	.BeginUpdate
	.VisualAppearance.Add(1,"c:\exontrol\images\normal.ebn")
	.Import("C:\Program Files\Exontrol\ExPivot\Sample\data.txt")
	.FormatConditionalAppearances.item("positive").BackColor = 0x100ff00
	.FormatConditionalAppearances.item("negative").BackColor = 0x10000ff
	.PivotRows = "0"
	.PivotColumns = "sum(5)[positive,negative]/12"
	.ExpandAll
	var_CopyTo = .CopyTo("c:/temp/xtest.pdf")
	DEBUGOUT( "Look for C:\Temp\xtest.pdf file." )
	.EndUpdate
endwith
|
|
76
|
Does / could the control have a read-only mode by where I could load the data and layout and just use the control to display it and allow the user to scroll around it / print it but not change it
with thisform.Pivot1
	.Import("C:\Program Files\Exontrol\ExPivot\Sample\data.txt")
	.PivotRows = "0"
	.PivotColumns = "sum(5)[content=numeric]"
	.DisplayFilterList = 2
	.PivotBarVisible = 268435977 && PivotBarVisibleEnum.exPivotBarReadOnly Or PivotBarVisibleEnum.exPivotBarAutoUpdate Or PivotBarVisibleEnum.exPivotBarAutoFit Or PivotBarVisibleEnum.exPivotBarVisible
	.Refresh
endwith
|
|
75
|
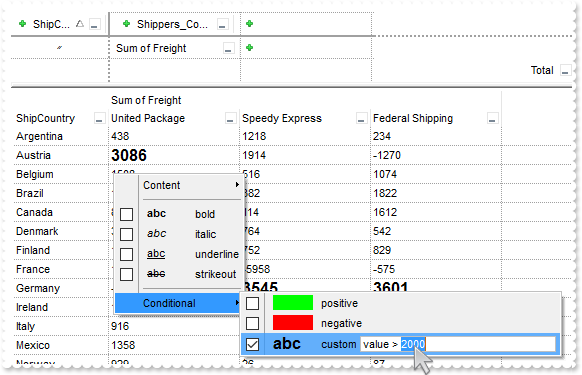
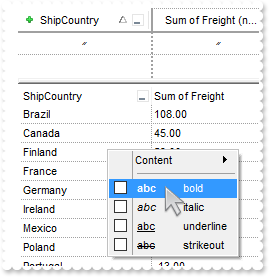
Is it possible to edit the conditional-expression at runtime
with thisform.Pivot1
	.BeginUpdate
	.Import("C:\Program Files\Exontrol\ExPivot\Sample\data.txt")
	with .FormatConditionalAppearances.Add("custom","custom","")
		.Bold = .T.
		.FontSize = 12
		.Expression = "value > 2000"
		.ContextEditExpression = .T.
	endwith
	.PivotRows = "0"
	.PivotColumns = "sum(5)[custom]/12"
	.EndUpdate
endwith
|
|
74
|
How can I highlight values using EBN colors
with thisform.Pivot1
	.BeginUpdate
	.VisualAppearance.Add(1,"c:\exontrol\images\normal.ebn")
	.Import("C:\Program Files\Exontrol\ExPivot\Sample\data.txt")
	.FormatConditionalAppearances.item("positive").BackColor = 0x100ff00
	.FormatConditionalAppearances.item("negative").BackColor = 0x10000ff
	.PivotRows = "0"
	.PivotColumns = "sum(5)[positive,negative]/12"
	.EndUpdate
endwith
|
|
73
|
How do I mark not-empty values in the chart
with thisform.Pivot1
	.BeginUpdate
	.Import("C:\Program Files\Exontrol\ExPivot\Sample\data.txt")
	.PivotRows = "0"
	with .FormatConditionalAppearances.Add("nempty","not empty","")
		.Expression = "len(value) != 0"
		.BackColor = RGB(240,240,240)
	endwith
	.PivotColumns = "sum(5)[nempty]/12"
	.EndUpdate
endwith
|
|
72
|
How can I highlight negative and positive values in the same chart
with thisform.Pivot1
	.BeginUpdate
	.Import("C:\Program Files\Exontrol\ExPivot\Sample\data.txt")
	.PivotRows = "0"
	.PivotColumns = "sum(5)[negative,positive]/12"
	.EndUpdate
endwith
|
|
71
|
How can I highlight values that starts with a letter
with thisform.Pivot1
	.BeginUpdate
	with .FormatConditionalAppearances.Add("f","starts with f","lower(value) startwith `f`")
		.Expression = "lower(value) startwith `f`"
		.Shadow = RGB(1,0,0)
		.ShadowOffset = 0
	endwith
	.Import("C:\Program Files\Exontrol\ExPivot\Sample\data.txt")
	.PivotRows = "0[f]"
	.EndUpdate
endwith
|
|
70
|
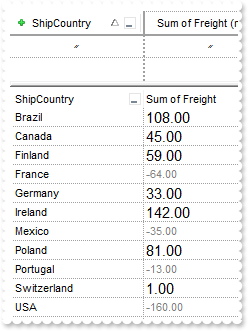
How can I mark values greater than a value, 100 for instance
with thisform.Pivot1
	.BeginUpdate
	with .FormatConditionalAppearances.Add("greater100",">100","value > 100")
		.Expression = "( dbl(value) != 0 ) ? (value > 100) : 0"
		.ForeColor = RGB(255,0,0)
	endwith
	.Import("C:\Program Files\Exontrol\ExPivot\Sample\data.txt")
	.PivotRows = "0"
	.PivotColumns = "sum(5)[greater100,content=numeric]"
	.EndUpdate
endwith
|
|
69
|
How can I remove the Conditional context-menu
with thisform.Pivot1
	.BeginUpdate
	.PivotBarVisible = 4059 && PivotBarVisibleEnum.exPivotBarAllowResizeColumns Or PivotBarVisibleEnum.exPivotBarAllowUndoRedo Or PivotBarVisibleEnum.exPivotBarAutoUpdate Or PivotBarVisibleEnum.exPivotBarAllowFormatContent Or PivotBarVisibleEnum.exPivotBarAllowFormatAppearance Or PivotBarVisibleEnum.exPivotBarAllowValues Or PivotBarVisibleEnum.exPivotBarShowTotals Or PivotBarVisibleEnum.exPivotBarAutoFit Or PivotBarVisibleEnum.exPivotBarSizable Or PivotBarVisibleEnum.exPivotBarVisible
	.Import("C:\Program Files\Exontrol\ExPivot\Sample\data.txt")
	.PivotRows = "0"
	.PivotColumns = "sum(5)[content=numeric]"
	.EndUpdate
endwith
|
|
68
|
How do change the way the negative/positive numbers show when using conditional-format
with thisform.Pivot1
	.BeginUpdate
	.Import("C:\Program Files\Exontrol\ExPivot\Sample\data.txt")
	with .FormatConditionalAppearances.item("negative")
		.BackColor = RGB(0,0,0)
		.ForeColor = RGB(128,128,128)
		.FontSize = 8
	endwith
	with .FormatConditionalAppearances.item("positive")
		.BackColor = RGB(0,0,0)
		.ForeColor = RGB(1,0,0)
		.FontSize = 11
	endwith
	.PivotRows = "0"
	.PivotColumns = "sum(5)[negative,positive,content=numeric]"
	.EndUpdate
endwith
|
|
67
|
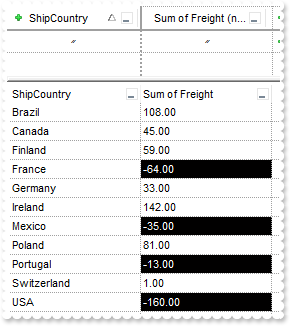
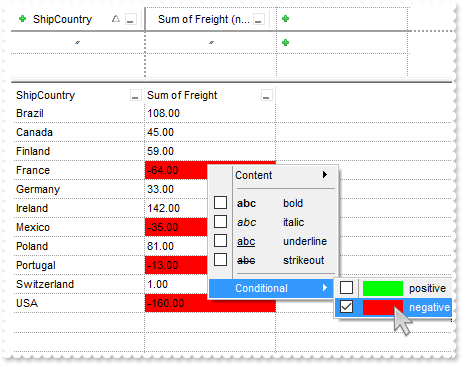
How do I highlight the negative values with white color or black
with thisform.Pivot1
	.BeginUpdate
	.Import("C:\Program Files\Exontrol\ExPivot\Sample\data.txt")
	with .FormatConditionalAppearances.item("negative")
		.BackColor = RGB(1,0,0)
		.ForeColor = RGB(255,255,255)
	endwith
	.PivotRows = "0"
	.PivotColumns = "sum(5)[negative,content=numeric]"
	.EndUpdate
endwith
|
|
66
|
Does your control support conditional-format, so I can highlight certain values
with thisform.Pivot1
	.BeginUpdate
	.Import("C:\Program Files\Exontrol\ExPivot\Sample\data.txt")
	.PivotRows = "0"
	.PivotColumns = "sum(5)[negative,content=numeric]"
	.EndUpdate
endwith
|
|
65
|
How do I add a computed column/field, like VAT for instance (method 2)
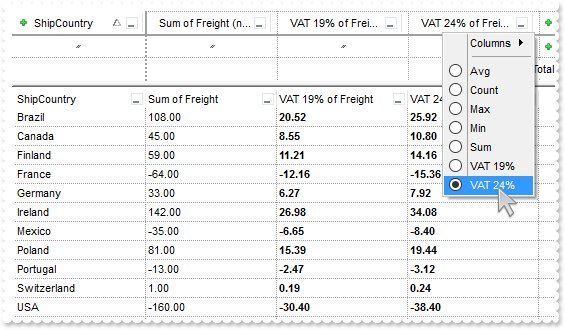
with thisform.Pivot1
	.BeginUpdate
	with .Aggregates
		.Add("vat19","sum","VAT 19%","VAT 19%").FormatValue = "value * 0.19"
		.Add("vat24","sum","VAT 24%","VAT 24%").FormatValue = "value * 0.24"
	endwith
	.Import("C:\Program Files\Exontrol\ExPivot\Sample\data.txt")
	.PivotRows = "0"
	.PivotColumns = "sum(5)[content=numeric],vat19(5)[bold,content=numeric],vat24(5)[bold,content=numeric]"
	.EndUpdate
endwith
|
|
64
|
How do I add a computed column/field, like VAT for instance (method 1)
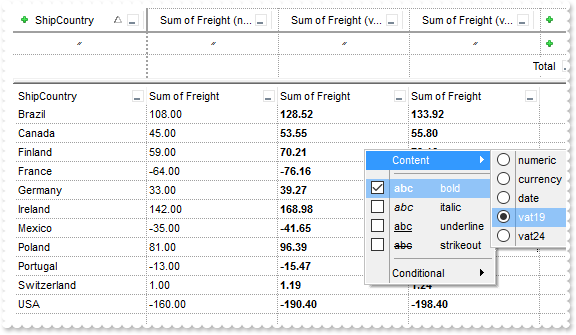
with thisform.Pivot1
	.BeginUpdate
	with .FormatContents.Add("vat19","VAT 19%")
		.Expression = "len(value) ? ((value * 1.19) format '') : ''"
	endwith
	with .FormatContents.Add("vat24","VAT 24%")
		.Expression = "len(value) ? ((value * 1.24) format '') : ''"
	endwith
	.Import("C:\Program Files\Exontrol\ExPivot\Sample\data.txt")
	.PivotRows = "0"
	.PivotColumns = "sum(5)[content=numeric],sum(5)[bold,content=vat19],sum(5)[bold,content=vat24]"
	.EndUpdate
endwith
|
|
63
|
How can I hide some values for instance negative values
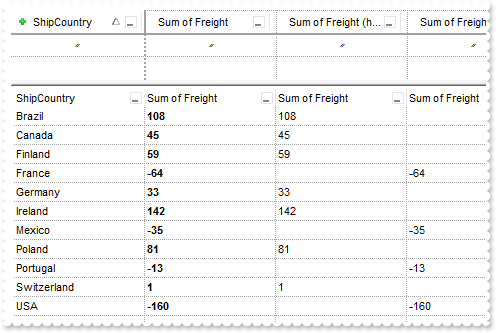
with thisform.Pivot1
	.BeginUpdate
	with .FormatContents.Add("hiden","hide negative")
		.Expression = "value < 0 ? `` : value"
	endwith
	with .FormatContents.Add("hidep","hide positive")
		.Expression = "value > 0 ? `` : value"
	endwith
	.Import("C:\Program Files\Exontrol\ExPivot\Sample\data.txt")
	.PivotRows = "0"
	.PivotColumns = "sum(5)[bold],sum(5)[content=hiden],sum(5)[content=hidep]"
	.EndUpdate
endwith
|
|
62
|
How can I decode the Layout property
with thisform.Pivot1
	.BeginUpdate
	.Import("C:\Program Files\Exontrol\ExPivot\Sample\data.txt")
	.PivotRows = "0"
	.PivotColumns = "sum(5)/12"
	.Layout = "Columns =1;C0.Width = 64"
	with CreateObject("Exontrol.Print")
		DEBUGOUT( .Decode64TextW(thisform.Pivot1.Layout) )
	endwith
	.EndUpdate
endwith
|
|
61
|
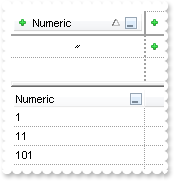
How can I specify the sorting type, so the column gets sorted as numeric for instance
with thisform.Pivot1
	.Import("1,1#11,11#101,101","eor='#' eof=',' hdr=0")
	with .DataColumns.item(0)
		.Caption = "Numeric"
		.SortType = 1
	endwith
	.DataColumns.item(1).Caption = "String (default)"
	.PivotRows = "0"
	.Refresh
endwith
|
|
60
|
How can I disable the control's context menu
with thisform.Pivot1
	.Import("C:\Program Files\Exontrol\ExPivot\Sample\data.txt")
	.PivotRows = "0"
	.PivotBarVisible = 3675 && PivotBarVisibleEnum.exPivotBarAllowResizeColumns Or PivotBarVisibleEnum.exPivotBarAllowUndoRedo Or PivotBarVisibleEnum.exPivotBarAutoUpdate Or PivotBarVisibleEnum.exPivotBarAllowValues Or PivotBarVisibleEnum.exPivotBarShowTotals Or PivotBarVisibleEnum.exPivotBarAutoFit Or PivotBarVisibleEnum.exPivotBarSizable Or PivotBarVisibleEnum.exPivotBarVisible
endwith
|
|
59
|
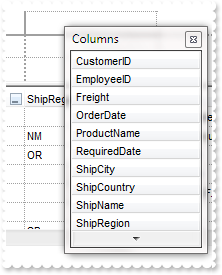
How do I get the captions of the columns
with thisform.Pivot1
	.Import("C:\Program Files\Exontrol\ExPivot\Sample\data.txt")
	DEBUGOUT( .DataColumns.Count )
	DEBUGOUT( .DataColumns.item(0).PivotCaption )
	DEBUGOUT( .DataColumns.item(0).Caption )
	DEBUGOUT( .DataColumns.item(1).PivotCaption )
	DEBUGOUT( .DataColumns.item(1).Caption )
endwith
|
|
58
|
How can I specify the default-format for a specified column, so it always shows as numeric for instance
with thisform.Pivot1
	.Import("C:\Program Files\Exontrol\ExPivot\Sample\data.txt")
	with .DataColumns.item("Freight")
		.DefaultFormatContent = "numeric"
		.DefaultFormatAppearances = "bold"
		.SortOrder = 1
		.SortType = 1
	endwith
	.PivotTotalDefaultFormatContent = "currency"
	.PivotTotalDefaultFormatAppearances = "strikeout,bold"
	.PivotRows = "0"
	.PivotColumns = "sum(5)[bold,content=numeric]"
	.PivotTotals = "sum[strikeout,bold,content=currency]"
	.PivotColumnsFloatBarVisible = .T.
	.Refresh
endwith
|
|
57
|
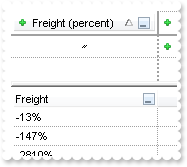
How can I display the percentage column
with thisform.Pivot1
	.FormatContents.Add("percent","value + `%`")
	.Import("C:\Program Files\Exontrol\ExPivot\Sample\data.txt")
	.PivotRows = "5[content=percent]"
	.Refresh
endwith
|
|
56
|
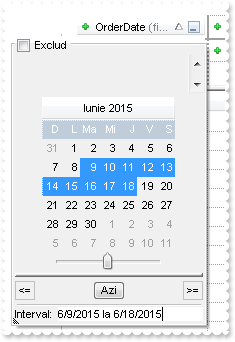
How do I change the name for months in the drop-down filter window (localization)
with thisform.Pivot1
	DEBUGOUT( .Description(17) )
	.Object.Description(17) = "Ianuarie Februarie Martie Aprilie Mai Iunie Iulie August Septembrie Octombrie Noiembrie Decembrie"
	.Object.Description(0) = "(Toate)"
	.Object.Description(1) = "(Gol)"
	.Object.Description(2) = "(Plin)"
	.Object.Description(3) = "Filtreaza:"
	.Object.Description(16) = "Azi"
	.Object.Description(18) = "D L Ma Mi J V S"
	.Object.Description(25) = "Exclud"
	.Object.Description(26) = "Coloane"
	.Object.Description(11) = "si"
	.Object.Description(12) = "Data:"
	.Object.Description(15) = "Data"
	.Object.Description(13) = "la"
	.Object.Description(24) = "nu"
	.Object.Description(23) = "sau"
	.Import("C:\Program Files\Exontrol\ExPivot\Sample\data.txt")
	.DataColumns.item("OrderDate").SortType = 2
	.PivotRows = "9"
	.Refresh
endwith
|
|
55
|
How can I scale and print programmatically the pivot table, to fit on one axis eg FitPageHeight but infinite width etc
with thisform.Pivot1
	.Import("C:\Program Files\Exontrol\ExPivot\Sample\data.txt")
	.PivotRows = "6"
	.PivotColumns = "sum(5)/3"
	.Refresh
	with CreateObject("Exontrol.Print")
		.Options = "FitToPage = x 5"
		.PrintExts = thisform.Pivot1
		.Preview
	endwith
endwith
|
|
54
|
How can I scale and print programmatically the pivot table, to fit on one axis eg FitPageWidth but infinite height etc
with thisform.Pivot1
	.Import("C:\Program Files\Exontrol\ExPivot\Sample\data.txt")
	.PivotRows = "6"
	.PivotColumns = "sum(5)/3"
	.Refresh
	with CreateObject("Exontrol.Print")
		.Options = "FitToPage = 5 x"
		.PrintExts = thisform.Pivot1
		.Preview
	endwith
endwith
|
|
53
|
How can I get the column from the cursor
*** MouseMove event - Occurs when the user moves the mouse. ***
LPARAMETERS Button, Shift, X, Y
	with thisform.Pivot1
		DEBUGOUT( .ColumnFromPoint(-1,-1) )
	endwith

with thisform.Pivot1
	.Import("C:\Program Files\Exontrol\ExPivot\Sample\data.txt")
	.Refresh
endwith
|
|
52
|
How can I get the value from the cursor
*** MouseMove event - Occurs when the user moves the mouse. ***
LPARAMETERS Button, Shift, X, Y
	with thisform.Pivot1
		DEBUGOUT( .ValueFromPoint(-1,-1) )
	endwith

with thisform.Pivot1
	.Import("C:\Program Files\Exontrol\ExPivot\Sample\data.txt")
	.Refresh
endwith
|
|
51
|
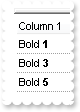
How can I specify a column to display HTML format
with thisform.Pivot1
	.Import("Bold <b>1,Bold <b>2#Bold <b>3,Bold <b>4#Bold <b>5,Bold <b>6","eor='#' eof=',' hdr=0")
	.DataColumns.item(0).HTML = .T.
	.DataColumns.item(1).HTML = .T.
	.PivotRows = "0"
	.Refresh
endwith
|
|
50
|
Does your control supports scrolling by touching the screen
with thisform.Pivot1
	rs = CreateObject("ADOR.Recordset")
	with rs
		.Open("Data","Provider=Microsoft.ACE.OLEDB.12.0;Data Source=C:\Program Files\Exontrol\ExPivot\Sample\Access\sample.accdb",3,3)
	endwith
	.DataSource = rs
	.AutoDrag = 4112 && AutoDragEnum.exAutoDragScrollOnShortTouch Or AutoDragEnum.exAutoDragScroll
endwith
|
|
49
|
How can I specify programatically the width of the pivot column ( first column )
with thisform.Pivot1
	.BeginUpdate
	.Import("C:\Program Files\Exontrol\ExPivot\Sample\data.txt")
	.PivotRows = "0"
	.PivotColumns = "sum(5)/12"
	.Layout = "Columns =1;C0.Width = 64"
	.EndUpdate
endwith
|
|
48
|
How can I show the total of each row, when columns are shown as expanded
with thisform.Pivot1
	.BeginUpdate
	.IncludeExpandColumn = 1
	.Import("C:\Program Files\Exontrol\ExPivot\Sample\data.txt")
	.PivotRows = "0"
	.PivotColumns = "sum(5)/12"
	.EndUpdate
endwith
|
|
47
|
How can I prevent grouping by a specified column
with thisform.Pivot1
	.Import("C:\Program Files\Exontrol\ExPivot\Sample\data.txt")
	.DataColumns.item("Freight").AllowGroupBy = 0
endwith
|
|
46
|
How can I sort alphabetically the columns to be displayed in the context menu/floating panel
with thisform.Pivot1
	.Import("C:\Program Files\Exontrol\ExPivot\Sample\data.txt")
	.PivotBarVisible = 69595 && PivotBarVisibleEnum.exPivotBarContextSortAscending Or PivotBarVisibleEnum.exPivotBarAllowResizeColumns Or PivotBarVisibleEnum.exPivotBarAllowUndoRedo Or PivotBarVisibleEnum.exPivotBarAutoUpdate Or PivotBarVisibleEnum.exPivotBarAllowFormatContent Or PivotBarVisibleEnum.exPivotBarAllowFormatAppearance Or PivotBarVisibleEnum.exPivotBarAllowValues Or PivotBarVisibleEnum.exPivotBarShowTotals Or PivotBarVisibleEnum.exPivotBarAutoFit Or PivotBarVisibleEnum.exPivotBarSizable Or PivotBarVisibleEnum.exPivotBarVisible
	.PivotColumnsSortOrder = 1
	.PivotColumnsFloatBarVisible = .T.
endwith
|
|
45
|
How can I prevent dropping data to the control
with thisform.Pivot1
	.AllowDrop = .F.
endwith
|
|
44
|
Is it possible to allow incremental filtering on drop down filter window too, as I can on the control menus
with thisform.Pivot1
	var_DisplayFilterList = .DisplayFilterList && .DisplayFilterList
	.Import("C:\Program Files\Exontrol\ExPivot\Sample\data.txt")
	.PivotRows = "0"
	.DisplayFilterList = 42272 && FilterListEnum.exHideFilterPattern Or FilterListEnum.exFilterListDefault
endwith
|
|
43
|
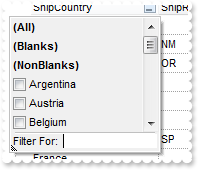
How can I prevent showing the Filter For field in the drop down filter window
with thisform.Pivot1
	var_DisplayFilterList = .DisplayFilterList && .DisplayFilterList
	.Import("C:\Program Files\Exontrol\ExPivot\Sample\data.txt")
	.PivotRows = "0"
	.DisplayFilterList = 42272 && FilterListEnum.exHideFilterPattern Or FilterListEnum.exFilterListDefault
endwith
|
|
42
|
How can I display the numeric columns only when selecting a new aggregate, like SUM
with thisform.Pivot1
	.Import("C:\Program Files\Exontrol\ExPivot\Sample\data.txt")
	.PivotRows = "0[bold]"
	.PivotColumns = "sum(5)/12,count(5)/12"
	.DataColumns.item("Freight").SortType = 1
endwith
|
|
41
|
How can I add a value column
with thisform.Pivot1
	.Import("C:\Program Files\Exontrol\ExPivot\Sample\data.txt")
	.PivotRows = "0"
	.PivotColumns = "sum(5)/12"
endwith
|
|
40
|
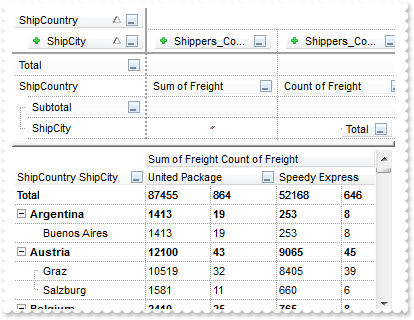
I would like to always have the subtotals in the same row of the "father row". Could that be done
with thisform.Pivot1
	.Import("C:\Program Files\Exontrol\ExPivot\Sample\data.txt")
	.PivotRows = "0[bold],2"
	.PivotColumns = "sum(5)/12,count(5)/12"
	.ShowViewCompact = 35 && ShowViewCompactEnum.exViewCompactAggregates Or ShowViewCompactEnum.exViewCompact
	.PivotTotals = "/sum,sum(0)"
endwith
|
|
39
|
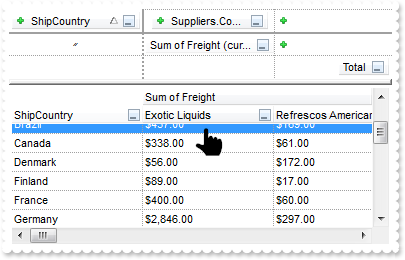
Is there any way, when I change the filter of the column, it broadcast the filter to the other pivot columns that were duplicated
with thisform.Pivot1
	.Import("C:\Program Files\Exontrol\ExPivot\Sample\data.txt")
	.PivotRows = "0,2"
	.ShowBranchRows = 2
	var_s = "sum(5)/12[filter='gBpNxjNh1MhlBoKNhpOZ0hJVNxpOhlMggKBhMZrMJnMoAgI='],count(5)/12[filter='gBpNxjNh1MhlBoKNhpOZ0hJVNxpOhlMggKBhMZr"
	var_s = var_s + "MJnMoAgI=']"
	.PivotColumns = var_s
	.ShowViewCompact = 19 && ShowViewCompactEnum.exViewCompactKeepSettings Or ShowViewCompactEnum.exViewCompact
endwith
|
|
38
|
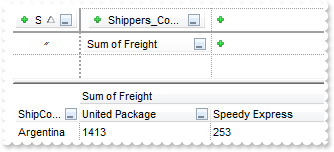
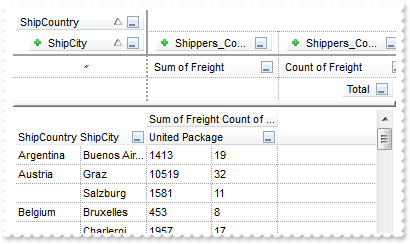
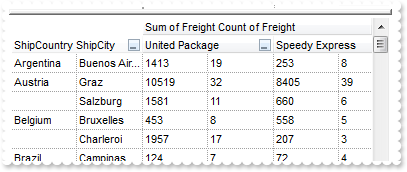
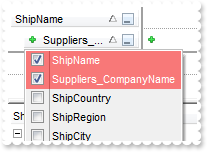
How can I summarize more fields in the same cell
with thisform.Pivot1
	.Import("C:\Program Files\Exontrol\ExPivot\Sample\data.txt")
	.PivotRows = "0,2"
	.ShowBranchRows = 2
	.PivotColumns = "sum(5)/12,count(5)/12"
	.ShowViewCompact = 3
endwith
|
|
37
|
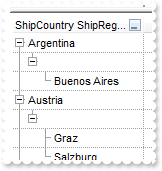
How do I programmatically group by rows, in a compact way, no hierarchy lines
with thisform.Pivot1
	.Import("C:\Program Files\Exontrol\ExPivot\Sample\data.txt")
	.PivotRows = "0,2"
	.ShowBranchRows = 2
endwith
|
|
36
|
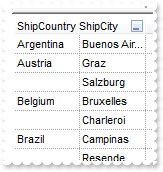
How do I programmatically group by rows
with thisform.Pivot1
	.Import("C:\Program Files\Exontrol\ExPivot\Sample\data.txt")
	.PivotRows = "0,1,2"
	.LinesAtRoot = -1
	.HasLines = 1
endwith
|
|
35
|
How do I programmatically group by columns
with thisform.Pivot1
	.Import("C:\Program Files\Exontrol\ExPivot\Sample\data.txt")
	.PivotRows = "0"
	.PivotColumns = "sum(5)/12;6"
endwith
|
|
34
|
How can I hide the add new button on the pivot bar
with thisform.Pivot1
	.Import("C:\Program Files\Exontrol\ExPivot\Sample\data.txt")
	.PivotBarVisible = 8155 && PivotBarVisibleEnum.exPivotBarHideAddNew Or PivotBarVisibleEnum.exPivotBarAllowResizeColumns Or PivotBarVisibleEnum.exPivotBarAllowUndoRedo Or PivotBarVisibleEnum.exPivotBarAutoUpdate Or PivotBarVisibleEnum.exPivotBarAllowFormatContent Or PivotBarVisibleEnum.exPivotBarAllowFormatAppearance Or PivotBarVisibleEnum.exPivotBarAllowValues Or PivotBarVisibleEnum.exPivotBarShowTotals Or PivotBarVisibleEnum.exPivotBarAutoFit Or PivotBarVisibleEnum.exPivotBarSizable Or PivotBarVisibleEnum.exPivotBarVisible
endwith
|
|
33
|
Is it possible to show the data that generated the result, when double clicking the row
with thisform.Pivot1
	.BeginUpdate
	.Import("C:\Program Files\Exontrol\ExPivot\Sample\data.txt")
	.PivotRows = "0[italic]"
	.PivotColumns = "count(0)[underline]"
	.PivotTotals = "count[bold,strikeout]"
	.ShowDataOnDblClick = .T.
	.EndUpdate
endwith
|
|
32
|
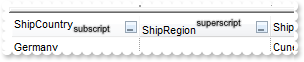
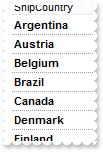
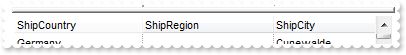
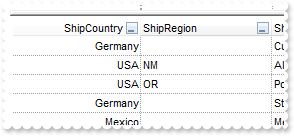
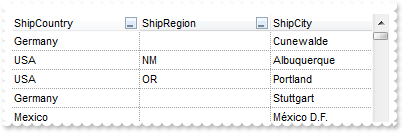
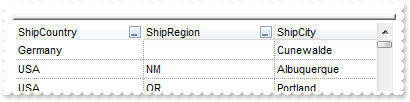
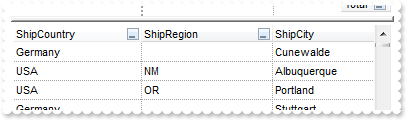
Does your control support subscript or superscript, in HTML captions
with thisform.Pivot1
	.HeaderHeight = 22
	.Import("C:\Program Files\Exontrol\ExPivot\Sample\data.txt")
	.DataColumns.item("ShipCountry").Caption = "ShipCountry<font ;7><off 6><sha ;;0>subscript"
	.DataColumns.item("ShipRegion").Caption = "ShipRegion<font ;7><off -6><sha ;;0>superscript"
	.Refresh
endwith
|
|
31
|
Is it possible to define a different background color for the pivot bar
with thisform.Pivot1
	.Object.Background(97) = RGB(240,240,240)
endwith
|
|
30
|
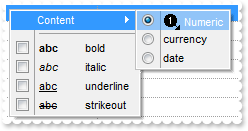
How can I display an icon/image to Content sub-menu
with thisform.Pivot1
	.Import("C:\Program Files\Exontrol\ExPivot\Sample\data.txt")
	var_s = "gBJJgBAIDAAGAAEAAQhYAf8Pf4hh0QihCJo2AEZjQAjEZFEaIEaEEaAIAkcbk0olUrlktl0vmExmUzmk1m03nE5nU7nk9n0/oFBoVDolFo1HpFJpVLplNp1PqFRqVTql"
	var_s = var_s + "Vq1XrFZrVbrldr1fsFhsVjslls1ntFptVrtltt1vuFxuVzul1u13vF5vV7vl9v1/wGBwWDwmFw2HxGJxWLxmNx0xiFdyOTh8Tf9ZymXx+QytcyNgz8r0OblWjyWds+m0"
	var_s = var_s + "ka1Vf1ta1+r1mos2xrG2xeZ0+a0W0qOx3GO4NV3WeyvD2XJ5XL5nN51aiw+lfSj0gkUkAEllHanHI5j/cHg8EZf7w8vl8j4f/qfEZeB09/vjLAB30+kZQAP/P5/H6/yN"
	var_s = var_s + "AOAEAwCjMBwFAEDwJBMDwLBYAP2/8Hv8/gAGAD8LQs9w/nhDY/oygIA="
	.Images(var_s)
	.FormatContents.item("numeric").Name = "<img>1</img> Numeric"
	.PivotRows = "5[content=numeric]"
endwith
|
|
29
|
How can I change the selection background in the control's context menu
with thisform.Pivot1
	.Import("C:\Program Files\Exontrol\ExPivot\Sample\data.txt")
	.Object.Background(20) = RGB(255,0,0)
endwith
|
|
28
|
How can I display the column as date in a long format
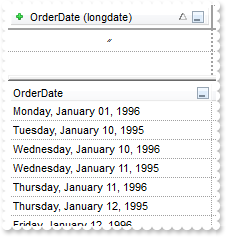
with thisform.Pivot1
	.Import("C:\Program Files\Exontrol\ExPivot\Sample\data.txt")
	.FormatContents.Add("longdate","longdate(date(value))")
	.PivotRows = "9[content=longdate]"
endwith
|
|
27
|
Is it possible to display the column in upper-case
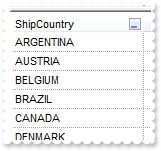
with thisform.Pivot1
	.Import("C:\Program Files\Exontrol\ExPivot\Sample\data.txt")
	.FormatContents.Add("upper","upper(value)")
	.PivotRows = "0[content=upper]"
endwith
|
|
26
|
How can I programatically bold a column
with thisform.Pivot1
	.Import("C:\Program Files\Exontrol\ExPivot\Sample\data.txt")
	.PivotRows = "0[bold]"
endwith
|
|
25
|
How can I display the total with a different foreground color
with thisform.Pivot1
	.FormatAppearances.Add("fore").ForeColor = RGB(255,0,0)
	.Import("C:\Program Files\Exontrol\ExPivot\Sample\data.txt")
	.PivotRows = "0"
	.PivotColumns = "sum(5)"
	.PivotTotals = "sum[fore,bold]"
endwith
|
|
24
|
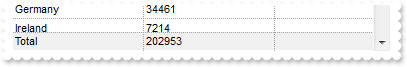
How can I display the total with a different background color/ebn
with thisform.Pivot1
	.VisualAppearance.Add(1,"c:\exontrol\images\normal.ebn")
	.FormatAppearances.Add("back").BackColor = 0x1000000
	.Import("C:\Program Files\Exontrol\ExPivot\Sample\data.txt")
	.PivotRows = "0"
	.PivotColumns = "sum(5)"
	.PivotTotals = "sum[back]"
endwith
|
|
23
|
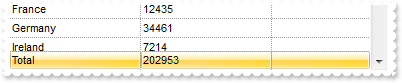
How can I display the total with a solid background color
with thisform.Pivot1
	.FormatAppearances.Add("back").BackColor = RGB(240,240,240)
	.Import("C:\Program Files\Exontrol\ExPivot\Sample\data.txt")
	.PivotRows = "0"
	.PivotColumns = "sum(5)"
	.PivotTotals = "sum[back]"
endwith
|
|
22
|
Is it possible to change the "bold" caption in the control's context menu
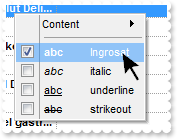
with thisform.Pivot1
	.Import("C:\Program Files\Exontrol\ExPivot\Sample\data.txt")
	.FormatAppearances.item("bold").Name = "Ingrosat"
endwith
|
|
21
|
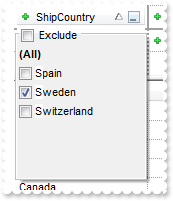
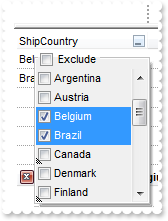
Is it possible to show no Exclude field in the filter window
with thisform.Pivot1
	.Import("C:\Program Files\Exontrol\ExPivot\Sample\data.txt")
	.DisplayFilterList = 288 && FilterListEnum.exShowCheckBox Or FilterListEnum.exSortItemsAsc
endwith
|
|
20
|
How can I prevent showing the drop down filter button
with thisform.Pivot1
	.Import("C:\Program Files\Exontrol\ExPivot\Sample\data.txt")
	.DisplayFilterList = 2
endwith
|
|
19
|
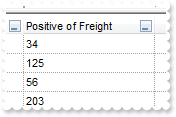
How do I get the count of positive values only
with thisform.Pivot1
	.Import("C:\Program Files\Exontrol\ExPivot\Sample\data.txt")
	.Aggregates.Add("positive","sum").FormatValue = "value < 0 ? 0 : 1"
	.PivotRows = "0"
	.PivotColumns = "positive(5)"
endwith
|
|
18
|
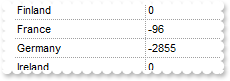
How do I get the sum for negative values only
with thisform.Pivot1
	.Import("C:\Program Files\Exontrol\ExPivot\Sample\data.txt")
	.Aggregates.Add("negative","sum").FormatValue = "value < 0 ? value : 0"
	.PivotRows = "0"
	.PivotColumns = "negative(5)"
endwith
|
|
17
|
My data stores the data as strings, is it possible to load the data using Import method
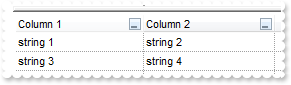
with thisform.Pivot1
	.Import("'string 1';'string 2'#'string 3';'string 4'","str=`'` eor='#' eof=';' hdr=0")
endwith
|
|
16
|
Is it possible to load data using different separators
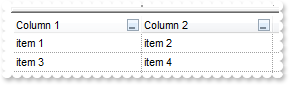
with thisform.Pivot1
	.Import("item 1;item 2#item 3;item 4","eor='#' eof=';' hdr=0")
endwith
|
|
15
|
Is it possible to align a column
with thisform.Pivot1
	.Import("C:\Program Files\Exontrol\ExPivot\Sample\data.txt")
	with .DataColumns.item(0)
		.Alignment = 2
		.HeaderAlignment = 2
	endwith
	.Refresh
endwith
|
|
14
|
How can I change by code the column/rows background color
with thisform.Pivot1
	.BeginUpdate
	.VisualAppearance.Add(1,"c:\exontrol\images\normal.ebn")
	.Import("C:\Program Files\Exontrol\ExPivot\Sample\data.txt")
	.FormatAppearances.Add("aka").BackColor = 0x1000000
	.PivotRows = "0[aka]"
	.EndUpdate
endwith
|
|
13
|
How can I apply by code any appearance to my list
with thisform.Pivot1
	.BeginUpdate
	.Import("C:\Program Files\Exontrol\ExPivot\Sample\data.txt")
	.PivotRows = "0[italic]"
	.PivotColumns = "count(0)[underline]"
	.PivotTotals = "count[bold,strikeout]"
	.EndUpdate
endwith
|
|
12
|
How can I display an icon instead SUM/Total field
with thisform.Pivot1
	.BeginUpdate
	var_s = "gBJJgBggAAwAAgACEKAD/hz/EMNh8TIRNGwAjEZAEXjAojJAjIgjIBAEijUlk8plUrlktl0vmExmUzmk1m03nE5nU7nk9n0/oFBoVDolFo1HpFJpVLplNp1PqFRqVTql"
	var_s = var_s + "Vq1XrFZrVbrldr1fsFhsVjslls1ntFptVrtltt1vuFxuVzul1u13vF5vV7vl9oEEwGBwWDwmFw2Hw9+xUsxGNx2Px+LyUnyGVy2VyeZAGNjIJjITjIb0OjjGi0ukAAVj"
	var_s = var_s + "ILzmayWtAGejCvjLh2u3jG23O4ACx1ew11+zEYGsZZsZUe/wkZ4sYZvD4PCy8kjAzjLFjKd5WDjIz6HRvnTwUZGMZX8ZTPb8XU8Hh9cFjALjKVjK5jIv9/w9t78WdjJI"
	var_s = var_s + "oyWr7sKjIWu+/a8Og2QAEajLaIxAzlwhB0DwQuzoECjJWw1DiMQ3D0OgAQMKwsuj8xOy0SrzFEWMdFUExbGMCRfC8ZRswMaLsiofJVHiOo+kKRs2lL2Jsh8cyQo6Ag=="
	.Images(var_s)
	.Import("C:\Program Files\Exontrol\ExPivot\Sample\data.txt")
	with .Aggregates.item("sum")
		.Name = "<img>1</img> Sum"
		.Caption = "<img>1</img>"
	endwith
	.PivotColumnsFloatBarVisible = .T.
	.FormatPivotHeader = "iaggregate ? (caggregate + (iaggregate != 5 ? ' ' : '') + caption) : caption"
	.FormatPivotTotal = "caggregate"
	.PivotRows = "0"
	.PivotColumns = "sum(5)"
	.PivotTotals = "sum,count"
	.EndUpdate
endwith
|
|
11
|
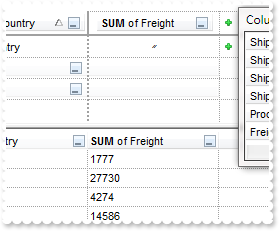
How can I change the caption to be displayed when dragging an aggregate function
with thisform.Pivot1
	.BeginUpdate
	.Import("C:\Program Files\Exontrol\ExPivot\Sample\data.txt")
	.PivotColumnsFloatBarVisible = .T.
	.FormatPivotHeader = "(iaggregate ? ('<b>' + upper(caggregate) + '</b> of ' + caption) : caption)"
	.PivotRows = "0"
	.PivotColumns = "sum(5)"
	.PivotTotals = "sum,count"
	.EndUpdate
endwith
|
|
10
|
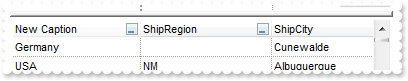
I am using Import method, just wondering if I can rename the columns
with thisform.Pivot1
	.Import("C:\Program Files\Exontrol\ExPivot\Sample\data.txt")
	with .DataColumns.item(0)
		.Caption = "New Caption"
		.PivotCaption = "New Pivot Caption"
	endwith
	.Refresh
endwith
|
|
9
|
Does your control support Fit-To-Page Print and Print Preview
with thisform.Pivot1
	.Import("C:\Program Files\Exontrol\ExPivot\Sample\data.txt")
	.PivotRows = "0,1,2"
	.ExpandAll
	with CreateObject("Exontrol.Print")
		.Options = "FitToPage = On"
		.PrintExts = thisform.Pivot1
		.Preview
	endwith
endwith
|
|
8
|
How can I print the control
with thisform.Pivot1
	.Import("C:\Program Files\Exontrol\ExPivot\Sample\data.txt")
	.PivotRows = "0,1,2"
	.ExpandAll
	with CreateObject("Exontrol.Print")
		.PrintExts = thisform.Pivot1
		.Preview
	endwith
endwith
|
|
7
|
How can I hide the pivot bar (hide completly)
with thisform.Pivot1
	.PivotBarVisible = 4058 && PivotBarVisibleEnum.exPivotBarAllowResizeColumns Or PivotBarVisibleEnum.exPivotBarAllowUndoRedo Or PivotBarVisibleEnum.exPivotBarAutoUpdate Or PivotBarVisibleEnum.exPivotBarAllowFormatContent Or PivotBarVisibleEnum.exPivotBarAllowFormatAppearance Or PivotBarVisibleEnum.exPivotBarAllowValues Or PivotBarVisibleEnum.exPivotBarShowTotals Or PivotBarVisibleEnum.exPivotBarAutoFit Or PivotBarVisibleEnum.exPivotBarSizable
endwith
|
|
6
|
How can I hide the pivot bar (auto-hide)
with thisform.Pivot1
	.PivotBarVisible = 4083 && PivotBarVisibleEnum.exPivotBarAllowResizeColumns Or PivotBarVisibleEnum.exPivotBarAllowUndoRedo Or PivotBarVisibleEnum.exPivotBarAutoUpdate Or PivotBarVisibleEnum.exPivotBarAllowFormatContent Or PivotBarVisibleEnum.exPivotBarAllowFormatAppearance Or PivotBarVisibleEnum.exPivotBarAllowValues Or PivotBarVisibleEnum.exPivotBarAutoHide Or PivotBarVisibleEnum.exPivotBarShowTotals Or PivotBarVisibleEnum.exPivotBarSizable Or PivotBarVisibleEnum.exPivotBarVisible
endwith
|
|
5
|
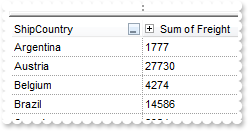
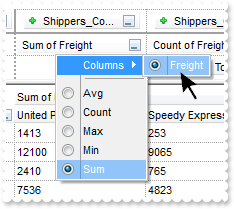
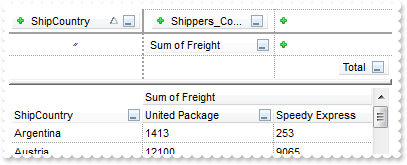
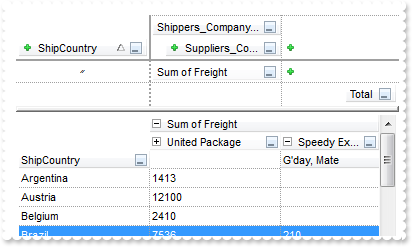
How can I count and get the total of a specified column
with thisform.Pivot1
	.BeginUpdate
	.Import("C:\Program Files\Exontrol\ExPivot\Sample\data.txt")
	.PivotColumnsFloatBarVisible = .T.
	.PivotRows = "0"
	.PivotColumns = "sum(5)"
	.PivotTotals = "sum,count"
	.EndUpdate
endwith
|
|
4
|
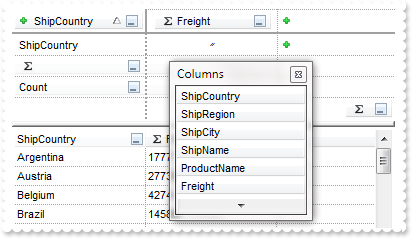
How can I add show the columns once I grouped a column
with thisform.Pivot1
	.Import("C:\Program Files\Exontrol\ExPivot\Sample\data.txt")
	.PivotRows = "0"
	.PivotColumnsFloatBarVisible = .T.
endwith
|
|
3
|
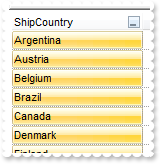
How can I programatically group the columns
with thisform.Pivot1
	.Import("C:\Program Files\Exontrol\ExPivot\Sample\data.txt")
	.PivotRows = "0:D"
endwith
|
|
2
|
Is it possible to load data from a data source
with thisform.Pivot1
	rs = CreateObject("ADOR.Recordset")
	with rs
		.Open("Data","Provider=Microsoft.ACE.OLEDB.12.0;Data Source=C:\Program Files\Exontrol\ExPivot\Sample\Access\sample.accdb",3,3)
	endwith
	.DataSource = rs
endwith
|
|
1
|
How can I load data
with thisform.Pivot1
	.Import("C:\Program Files\Exontrol\ExPivot\Sample\data.txt")
endwith
|